UAB's carbon footprint
Calculation of greenhouse gas emissions associated with the operation of the University
The carbon footprint of the UAB is the indicator of greenhouse gas (GHG) emissions associated with the operation of the university. It is quantified in CO2 equivalent emissions that are released into the atmosphere.
The GHG emissions to be considered in the methodology for calculating the carbon footprint are classified according to their generator:
- direct emissions of the organisation itself (according to the UNE-EN ISO 14064-1:2019 standard) or Scope 1 emissions (according to the Greenhouse Gas Protocol, GHG Protocol).
- indirect emissions, generated because of the organisation's activity, but which take place in sources that do not belong to the organisation, and which are not controlled by it, or Scope 2 and Scope 3 emissions.
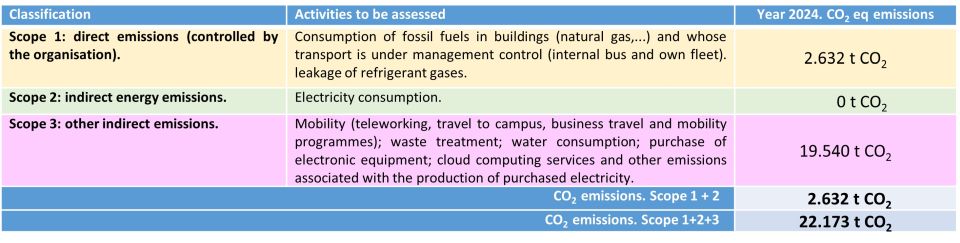
According to 2024 data, direct emissions controlled by the UAB, or Scope 1 emissions, represent 12% of the total. Direct emissions include those associated with the internal bus and own fleet, gas consumption and fugitive emissions of fluorinated gases from air conditioning and refrigeration equipment.
Indirect emissions, scope 3, account for the remaining 88%. Currently, these include consumption of purchased electricity (100% renewable), teleworking, transport to access the Campus (for the entire university community), business travel (for teaching staff and employees) and mobility programmes. They also include emissions from waste treatment, water consumption, capital goods (purchase of electronic equipment), cloud computing services, and other emissions associated with the production of purchased electricity. It should be added that since 2018 the UAB has been purchasing electricity from renewable energy sources certified with a guarantee of origin (GoO), so the indirect emissions of electricity, scope 2, are 0 tonnes of CO2 equivalent.
Broadly speaking, during 2024, 69% of GHG emissions at UAB came from mobility to access the campus, 10% from gas consumption in buildings and 7% from business travel.
In 2024 UAB joined the Voluntary Agreements Programme (VAP) for the reduction of greenhouse gases, through which member organisations commit to monitor their GHG emissions and establish annual measures to reduce them. For more information, you can consult the latest published report UAB 2023 annual report (document in Catalan), validated by the Catalan Office for Climate Change (OCCC) of the Catalan Government.
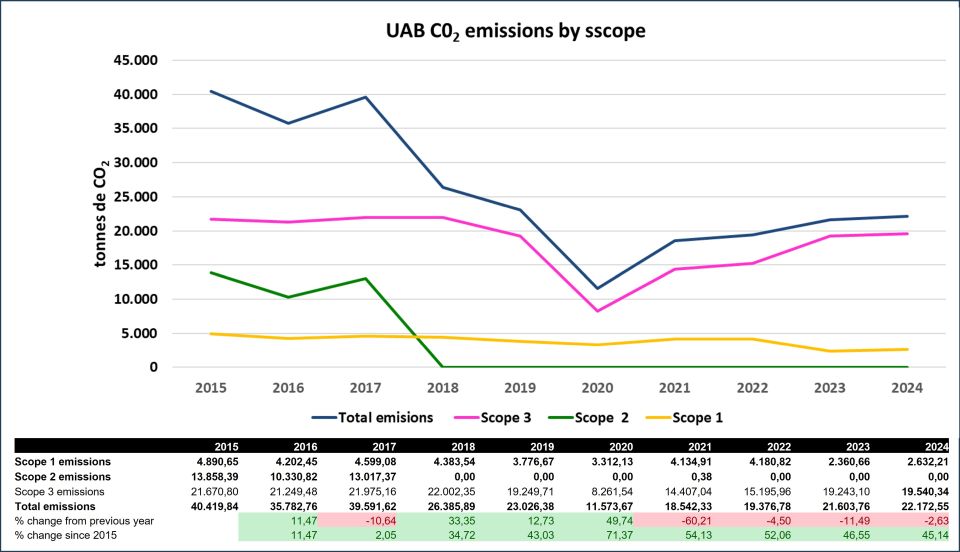
Las emisiones totales de gases de efecto invernadero (GEI) de la UAB han aumentado durante los últimos tres años, principalmente debido al incremento de las emisiones de alcance 3. Las emisiones de 2024 fueron de 22.173 toneladas equivalentes de CO₂, lo que representa un aumento del 2,6% respecto al 2,6% respecto.
Las emisiones directas, que incluyen las asociadas al bus interno ya la flota propia, al consumo de gas y los escapes de gases fluorados de los equipos de climatización y refrigeración, fueron de 2.632 toneladas equivalentes de CO₂, con un aumento del 11,5 % respecto al año anterior. Este incremento se explica principalmente por las recargas de gases refrigerantes derivadas de averías en equipos grandes de climatización (sobre todo enfriadoras), un factor que puede variar significativamente cada año.
Las emisiones indirectas suman un total de 19.540 toneladas equivalentes de CO₂, con un incremento del 1,5% respecto al año anterior. A pesar de la ampliación de las categorías consideradas, conviene añadir que el aumento global no ha sido especialmente elevado. En esta edición del inventario se han incorporado 746 toneladas equivalentes de CO₂ correspondientes a nuevas fuentes de emisión, como el teletrabajo, los programas de movilidad del estudiantado y los servicios de computación en la nube.