Global Atlas of Environmental Justice re-launches website
03/03/2015
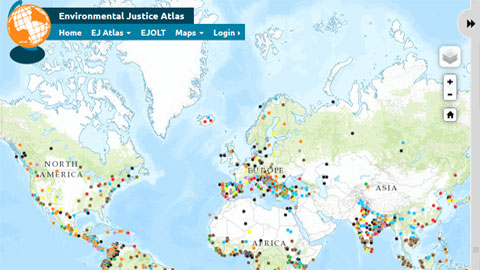
The EJOLT project recently launched a new phase of the Global Atlas of Environmental Justice, an interactive map cataloguing thousands of localised stories of resistance against projects which are damaging to the environment and the population. The new platform was launched at the closing meeting of the project in an international conference on Environmental Justice organised by the European Environmental Bureau in Brussels.
The Atlas is an initiative of the Environmental Justice Organisations, Liabilities and Trade (EJOLT) project, coordinated by the UAB's Institute of Environmental Science and Technology (ICTA) and dedicated to providing support to environmental justice organisations. The project is financed by the EU's 7th Framework Programme and directed by UAB professor Joan Martínez Alier.
Since its first launch on 19 March 2014, the atlas has received wide acclaim from media, academics and activists. Over a quarter million users opened almost a million pages. According to EJatlas coordinator and editor Dr. Leah Temper, “the new website will make the connections between economic activities, companies and environmental impacts even clearer. This will greatly enhance its use by environmental justice organisations and front-line communities”.
According to EJOLT collaborator and Michigan University professor Paul Mohai, “Those who have been observing, analysing, and writing about environmental injustice have consistently observed the importance of access to information and resources for communities experiencing environmental injustice. The EJatlas provides a powerful visual representation of the extent of environmental conflicts worldwide and underscores the importance and urgency of addressing these conflicts.”
Improvements to the Website
The new website includes the following modifications and improvements:
• Coverage of almost 1400 cases of environmental conflicts in all continents contributed by over 130 collaborators.
• Improved coverage from countries where information is hard to get, like China, Kazakhstan and Western Sahara. The reporting on these cases give essential backing and cover to harassed activists in these countries.
• A new dynamic interface with a feed featuring newly added, updated and recently commented cases. The new layout increases engagement, makes it easier to share on social media and to highlight hot cases in the news.
• Improved Search & Filter options. The search and filter functionality has been completely retooled. In addition to filters across over 50 categories of activities, groups mobilising, tactics employed, and by the success of the resistance efforts, a new logical box design allows and/or and not searches as well as filters by company and domestic country of the company and by International Institution.
• Featured maps that combine new geospatial data layers on issues such as water scarcity, forest cover, mining and oil concessions allowing greater insight into the context and the underlying social and environmental drivers of the conflicts. The 6 new featured maps include these 3:
- Fracking Frenzy: As conventional oil and gas resources deplete, the fossil fuel industry is increasingly turning to unconventional energy sources such as shale oil & gas and coal-bed methane. This map draws from the report "Fracking Frenzy" by Friends of the Earth and features data on risks to water reserves and mobilisations of “Fracktivist” movements in the South and worldwide.
- Mining in Latin America: Latin America has experienced a mining boom in the past four decades. This map displays how the expansion of the metal mining frontier overlaps with environmental (biodiversity hotspots, forests) and socially sensitive areas (water resources, peasant and indigenous lands) and the related conflicts, forty percent of which have seen violent repression or criminalisation of activists. The map integrates data from the Global Witness report “Deadly Environment” highlighting how environmentalists are being targeted for their defence of the environment.
- Climate Debt: “By over-consuming the available capacity of the Earth’s atmosphere and climate system to absorb greenhouse gases the developed countries have run up a climate debt to developing countries and mother Earth. This map highlights this spatial mal-distribution of climate change sources and impacts, displaying per capita CO2 emissions and a climate change vulnerability index as well as the total carbon debt/claim of 154 countries in 2011 in million tons of CO2 as calculated by Rikard Warlenius, Human Ecology, Lund University.
Other Countries: from Madagascar to Colombia
While EJatlas´ coverage of conflicts continues to expand, many regions, like Central Asia, the Middle East and China, are not duly represented yet. The EJatlas editors invite organisations and academics with expertise on specific issues to contribute to the further development of this constantly expanding database. They also invite collaboration in the creation of featured maps on specific issues of concern.
According to Temper, “this new phase of the Environmental Justice Atlas aims to deepen the discussion on social conflict related to environmental impacts and provide a forum for the claims for justice and alternatives voiced by the most impacted and marginalised communities.”
Atlas editor Daniela del Bene adds: “These new features help see these conflicts as embedded in an extractive global economy rather than as isolated complaints.”